
 Employee Status
| Category | Unit | 2023 | 2024 | 2025 | ||
|---|---|---|---|---|---|---|
| Total Employees | Total | Persons | 2,197 | 2,069 | 2,097 | |
| Male | Persons | 2,124 | 1,998 | 2,012 | ||
| Female | Persons | 73 | 71 | 85 | ||
| Employees by Employment Type |
Executive Officers1) | Male | Persons | 43 | 41 | 44 |
| Female | Persons | - | - | - | ||
| Fixed-Term Employees2) | Male | Persons | 395 | 381 | 395 | |
| Female | Persons | 20 | 20 | 27 | ||
| Employees with Indefinite-Term Contracts3) | Male | Persons | 1,729 | 1,617 | 1,617 | |
| Female | Persons | 53 | 51 | 58 | ||
| Workers Who Are Not Employees but Are Under the Organization’s Supervision4) | Headquarters | Persons | 1,222 | 1,537 | 1,552 | |
| Sites | Persons | - | - | - | ||
| Employees by Age |
Total | - | Persons | 1,782 | 1,668 | 1,675 |
| Under 30 | - | Persons | 88 | 61 | 98 | |
| Ages 30–50 | - | Persons | 994 | 919 | 893 | |
| Over 50 | - | Persons | 700 | 688 | 684 | |
| Employees by Position |
Unregistered Executive | Male | Persons | 59 | 53 | 54 |
| Female | Persons | - | - | - | ||
| General Manager | Male | Persons | 486 | 508 | 539 | |
| Female | Persons | - | - | - | ||
| Deputy General Manager | Male | Persons | 516 | 477 | 436 | |
| Female | Persons | 5 | 5 | 5 | ||
| Manager | Male | Persons | 185 | 148 | 138 | |
| Female | Persons | 25 | 26 | 26 | ||
| Assistant Manager | Male | Persons | 45 | 47 | 81 | |
| Female | Persons | 8 | 5 | 4 | ||
| Staff | Male | Persons | 438 | 384 | 375 | |
| Female | Persons | 15 | 15 | 17 | ||
| Female Employees |
Total Female Employees5) | Number | Persons | 53 | 51 | 58 |
| Percentage | % | 2.97 | 3.06 | 3.46 | ||
| Female Managers (*Manager level or above) | Number | Persons | 25 | 26 | 26 | |
| Percentage | % | 1.40 | 1.56 | 1.55 | ||
| Female Executives (*Assistant Managing Director level or above) | Number | Persons | - | - | - | |
| Percentage | % | - | - | - | ||
| Minority Groups |
Foreign Employees | Number | Persons | 201 | 196 | 201 |
| Employees with Disabilities | Number | Persons | 36 | 38 | 42 | |
| National Merit Beneficiaries | Number | Persons | 53 | 51 | 52 | |
1) “Employees” are calculated based on unregistered executives at the managing director level or above.
2) Fixed-term employees include unregistered executives but exclude registered directors.
3) Employees with indefinite-term contracts exclude executive officers.
4) Workers who are not employees but are under the organization’s supervision are based on “workers employed by other entities” as reported in the company’s Business Report.
5) Total female employees are based on employees with indefinite-term contracts.
New Hires| Category | Unit | 2023 | 2024 | 2025 | ||
|---|---|---|---|---|---|---|
| Total New Hires | Persons | 369 | 130 | 248 | ||
| By Gender | Male | Regular | Persons | 52 | 25 | 95 |
| Contract | Persons | 300 | 93 | 128 | ||
| Female | Regular | Persons | 7 | 1 | 7 | |
| Contract | Persons | 10 | 11 | 18 | ||
| By Age | Under 30 | Regular | Persons | 36 | 2 | 59 |
| Contract | Persons | 30 | 16 | 29 | ||
| Ages 30 to Under 51 | Regular | Persons | 16 | 22 | 41 | |
| Contract | Persons | 245 | 58 | 99 | ||
| Age 51 and Over | Regular | Persons | 7 | 2 | 2 | |
| Contract | Persons | 35 | 30 | 18 | ||
| New Hire Rate | % | 16.8% | 6.3% | 11.8% | ||
* New Hire Rate = New Hires / Total Employees
Employee Turnover| Category | Unit | 2023 | 2024 | 2025 | ||
|---|---|---|---|---|---|---|
| Total Departures | Persons | 170 | 256 | 202 | ||
| By Gender | Male | Regular | Persons | 94 | 127 | 84 |
| Contract | Persons | 64 | 117 | 105 | ||
| Female | Regular | Persons | 2 | 3 | 6 | |
| Contract | Persons | 10 | 9 | 7 | ||
| By Age | Under 30 | Regular | Persons | 11 | 11 | 5 |
| Contract | Persons | 17 | 14 | 13 | ||
| Ages 30 to Under 51 | Regular | Persons | 30 | 66 | 34 | |
| Contract | Persons | 30 | 65 | 71 | ||
| Age 51 and Over | Regular | Persons | 55 | 53 | 51 | |
| Contract | Persons | 27 | 47 | 28 | ||
| Turnover Rate | % | 7.74% | 12.37% | 9.63% | ||
| Category | Unit | 2023 | 2024 | 2025 | ||
|---|---|---|---|---|---|---|
| Voluntary Turnover | Persons | 120 | 132 | 32 | ||
| By Gender | Male | Regular | Persons | 70 | 86 | 29 |
| Contract | Persons | 46 | 39 | - | ||
| Female | Regular | Persons | 2 | 3 | 3 | |
| Contract | Persons | 2 | 4 | - | ||
| By Age | Under 30 | Regular | Persons | 11 | 11 | - |
| Contract | Persons | 9 | 7 | - | ||
| Ages 30 to Under 51 | Regular | Persons | 49 | 64 | 31 | |
| Contract | Persons | 27 | 32 | - | ||
| Age 51 and Over | Regular | Persons | 12 | 14 | 1 | |
| Contract | Persons | 12 | 4 | - | ||
| Voluntary Turnover Rate | % | 5.46% | 6.38% | 1.53% | ||
* Departures: Employees who leave the organization due to voluntary resignation, retirement, death while employed, or other reasons.
* Turnover Rate = Departures / Total Employees
* Voluntary Turnover Rate = Voluntary Departures / Total Employees
Job Competency Development Training (2025)| No | Program | Target Participants | Participants Completing Training (Persons) | Total Training Hours (Hr) | Training Cost (KRW million) |
|---|---|---|---|---|---|
| 1 | Construction Engineer Training (External) | Eligible Construction Engineers | 338 | 5,623 | 67.6 |
| 2 | New Employee Orientation Program | Employees Hired in 2025 | 50 | 4,600 | 95.5 |
| 3 | Legal Training | Employees Responsible for Contract-Related Work | 54 | 27 | - |
| 4 | External Training | Employees Requiring Certification Renewal, etc. | 51 | 901 | 17 |
| 5 | ISO 19011 Internal Auditor Training | Relevant Personnel | 24 | 96 | - |
| 6 | Statutory Ethics Training for Mutual Cooperation (External) | Administrative Personnel at Construction Sites | 60 | 480 | 8.1 |
| 7 | Ship & Offshore Design Research Presentation | Shipbuilding Engineers | 2 | 20 | 0.5 |
| Total | 579 | 11,747 | 188.7 | ||
* Excludes statutory mandatory training and company-wide common training.
Job Competency Development Training Content and Outcomes[ *As of 2025 ]
| No | Program | Training Content | Training Outcomes |
|---|---|---|---|
| 1 | Construction Engineer Training (External) |
|
|
| 2 | New Employee Orientation Program |
|
|
| 3 | New Employee Refresher Program |
|
|
| 4 | Mechanical/Electrical Job Training (1st Session) |
|
|
| 5 | Mechanical/Electrical Job Training (2nd Session) |
|
|
| 6 | Training for Environmental Information ERP System Administrators |
|
|
| 7 | Legal Training |
|
|
| 8 | External Training |
|
|
| 9 | ISO 19011 Internal Auditor Training |
|
|
| 10 | Ship & Offshore Design Research Presentation |
|
|
Employee Diversity Expansion Plan| Category | Unit | 2025 Performance | 2030 Target | Remarks |
|---|---|---|---|---|
| Increase in Female Employment | Persons | 9 | 88 |
|
| Increase in Employment of Persons with Disabilities | Persons | 25 | 40 |
|
| Increase in Senior Employment | Persons | 8 | 24 |
|
Labor-Management Relations| Indicator | Category | Unit | 2023 | 2024 | 2025 | |
|---|---|---|---|---|---|---|
| Construction Division | Labor Union | Employees Eligible for Union Membership | Persons | 871 | 809 | 809 |
| Union Members | Persons | 296 | 315 | 321 | ||
| Union Membership Rate | % | 34.0 | 38.9 | 39.7 | ||
| Collective Bargaining Agreement Coverage1) | % | 28.2 | 31.3 | 31.0 | ||
| Minimum Notice Period for Operational Changes2) | Days | Prior consultation stipulated | ||||
| Labor-Management Council | Labor-Management Council Meetings | Meetings | 4 | 6 | 4 | |
| Agenda Items | Cases | 4 | 6 | 6 | ||
| Shipbuilding Division | Labor Union | Employees Eligible for Union Membership | Persons | 856 | 780 | 763 |
| Union Members | Persons | 678 | 621 | 602 | ||
| Union Membership Rate | % | 79.2 | 79.6 | 78.9 | ||
| Collective Bargaining Agreement Coverage1) | % | 31.0 | 31.4 | 29.5 | ||
| Minimum Notice Period for Operational Changes2) | Days | Immediate notification (Article 14 of the Collective Bargaining Agreement) | ||||
| Labor-Management Council | Labor-Management Council Meetings | Meetings | 1 | 4 | 4 | |
| Agenda Items | Cases | 13 | 4 | 4 | ||
1) Collective Bargaining Agreement Coverage: Percentage of all employees covered by a collective bargaining agreement (this does not refer to the percentage of employees who are union members).
2) Minimum Notice Period for Operational Changes: The minimum period for notifying employees of significant operational changes (such as restructuring, suspension of operations, or mergers) and whether the collective bargaining agreement contains provisions regarding minimum notice periods and negotiations.
Eco-Friendly Plogging Campaign around Yangjeong Station, Namyangju, Gyeonggi-do (April 2025)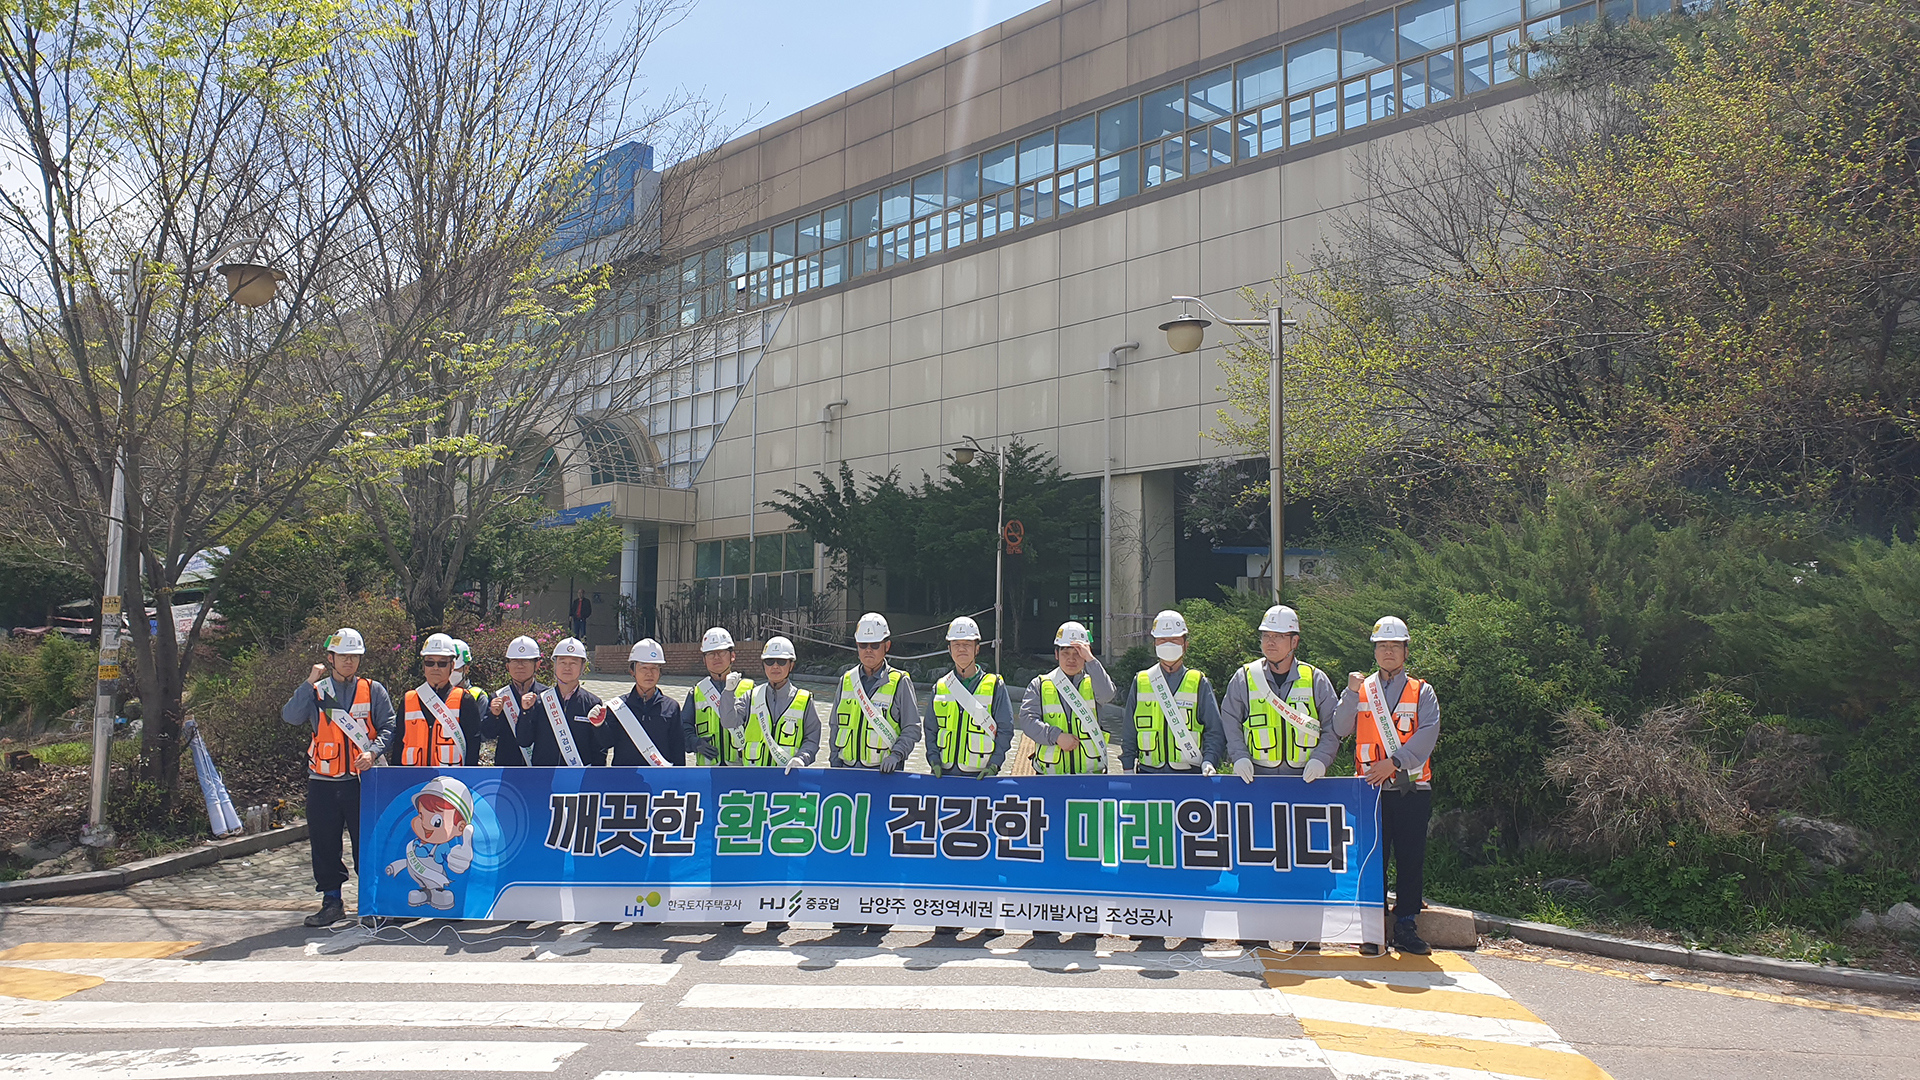
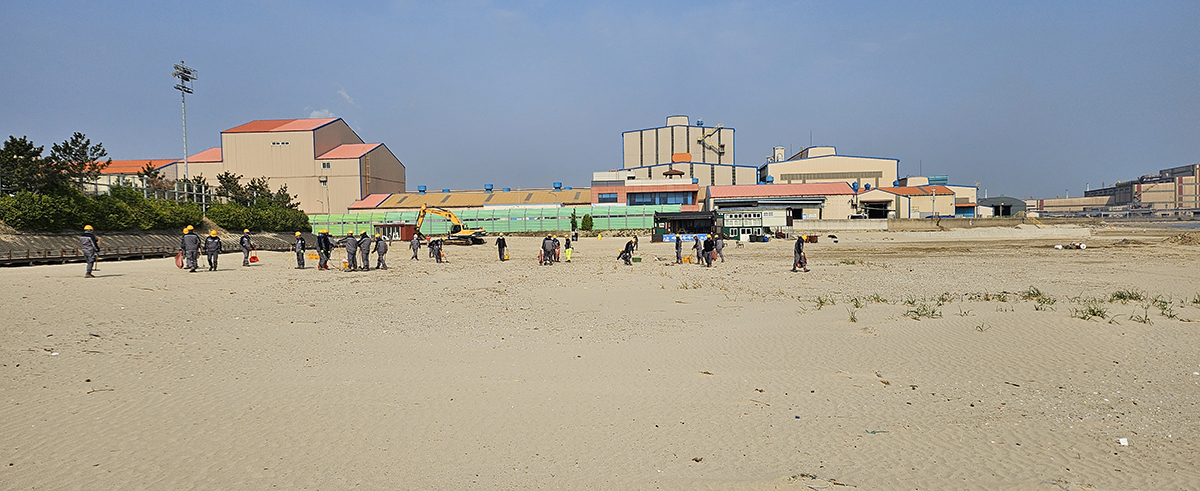
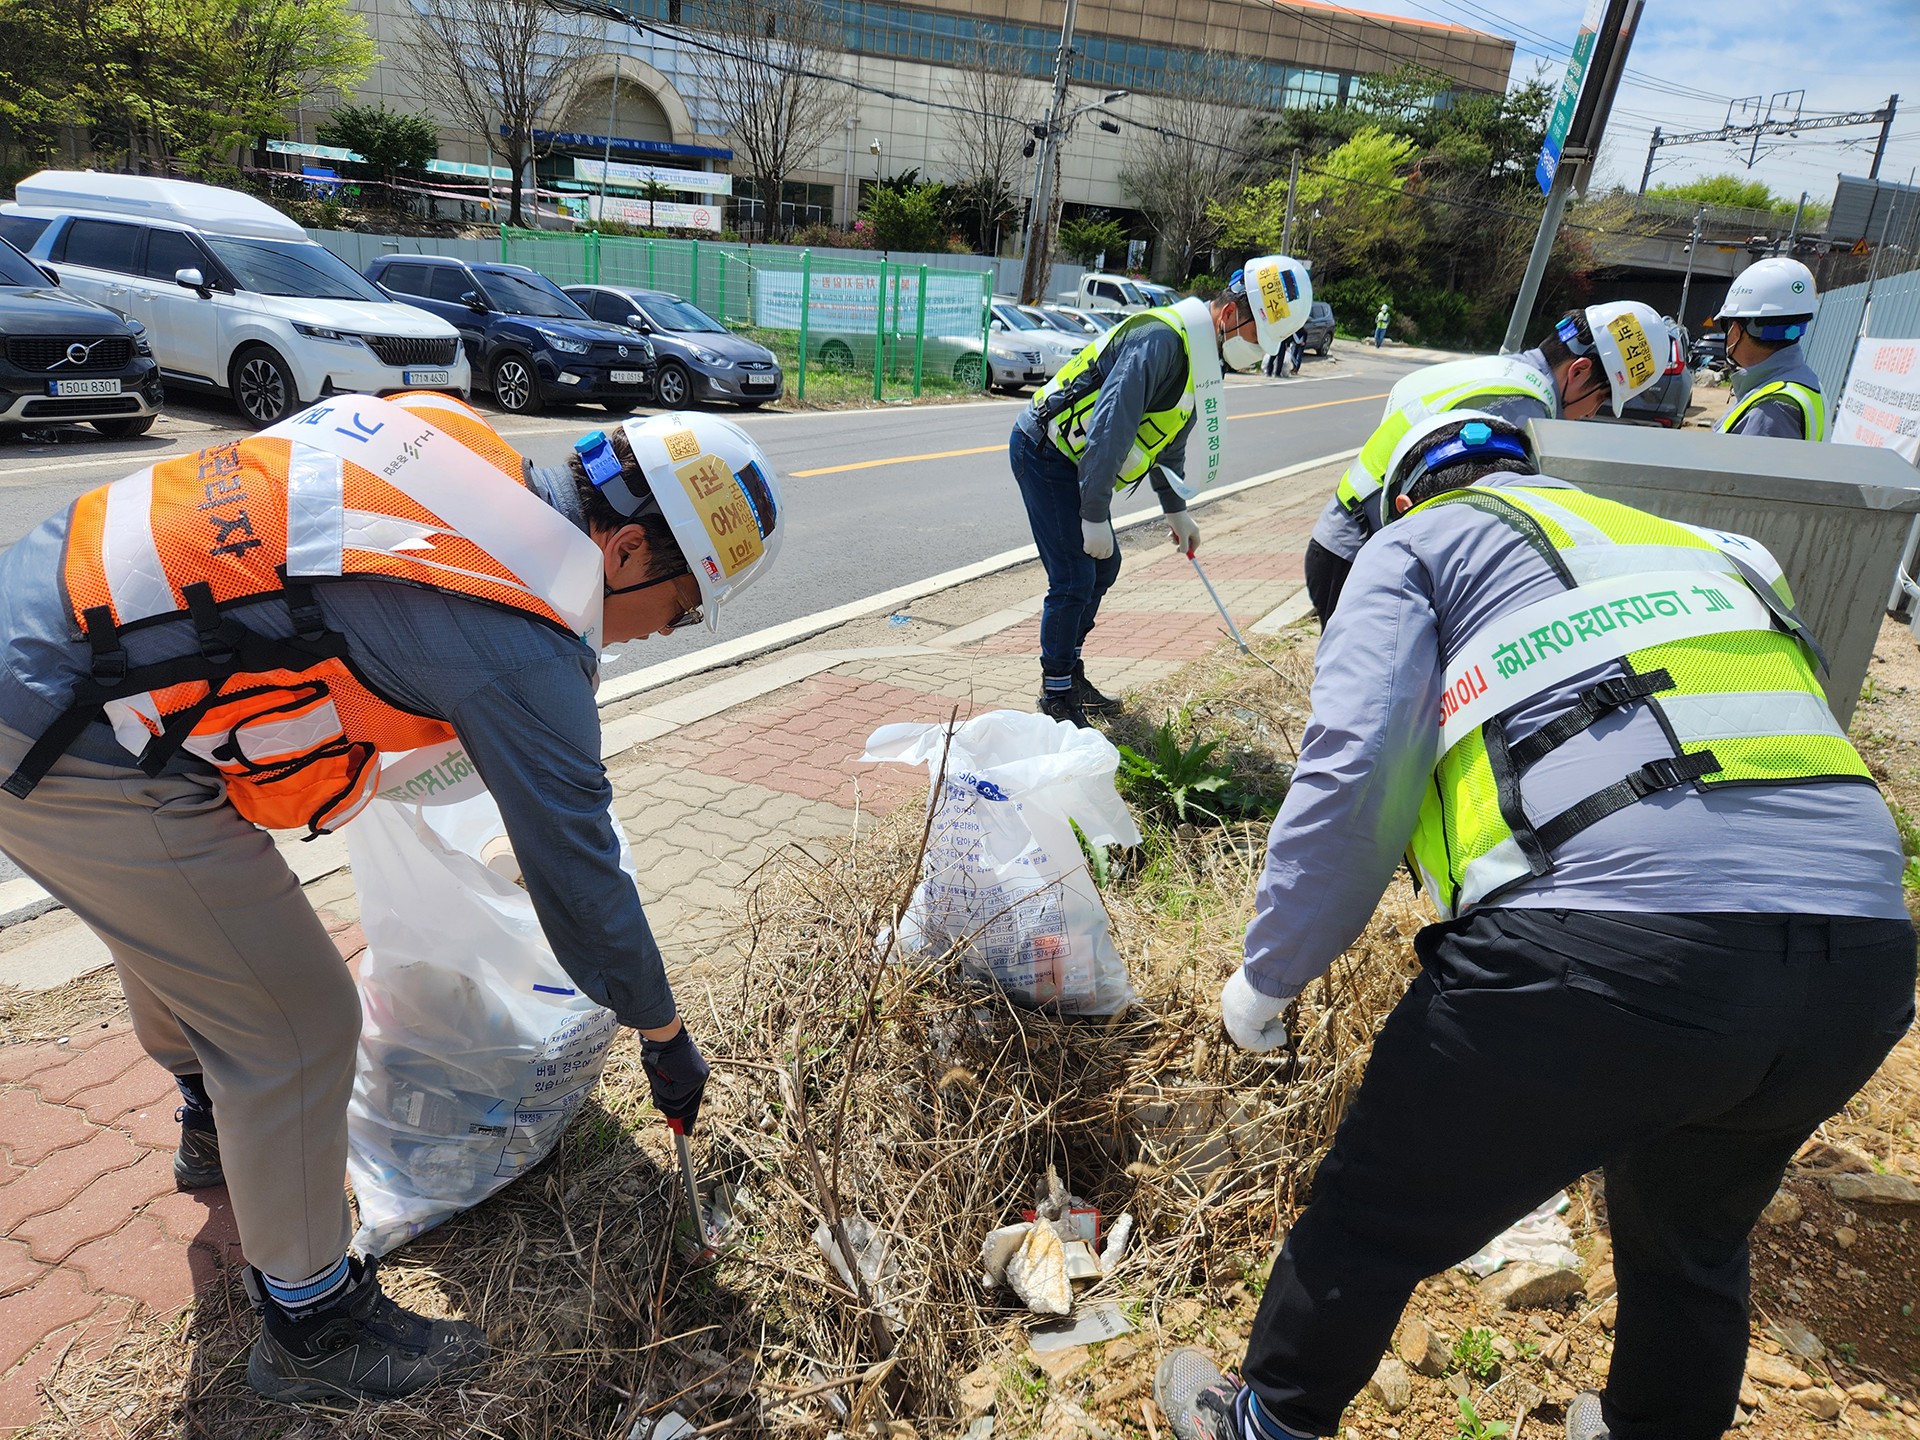 Environmental Cleanup Activity at Dogu Beach, Pohang, Gyeongsangbuk-do (April 2025)
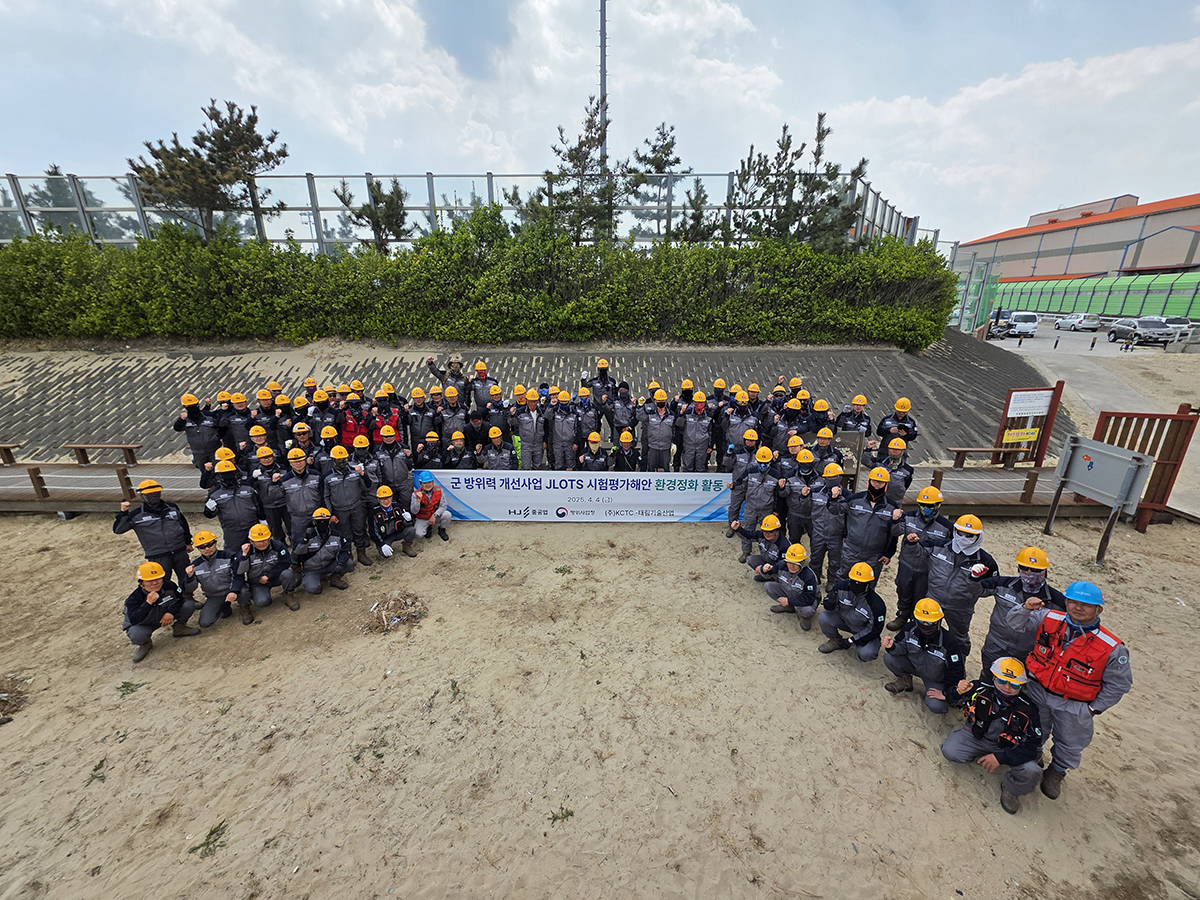
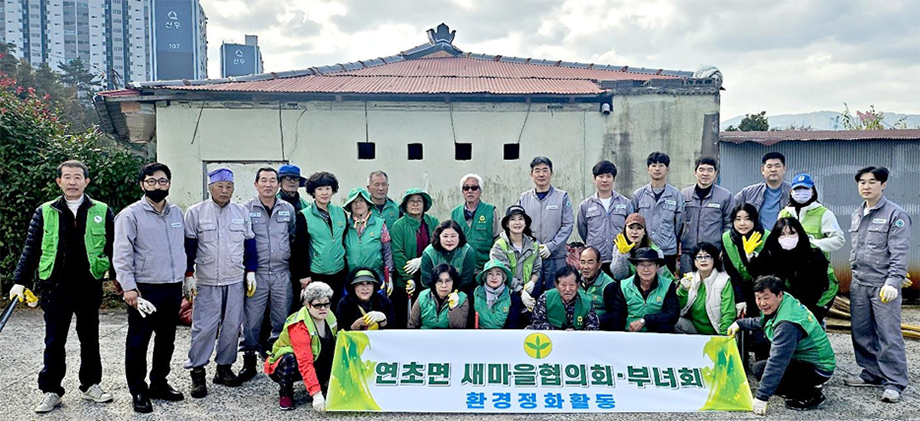
 Environmental Cleanup Activity in Yeoncho-myeon, Geoje (November 2024)
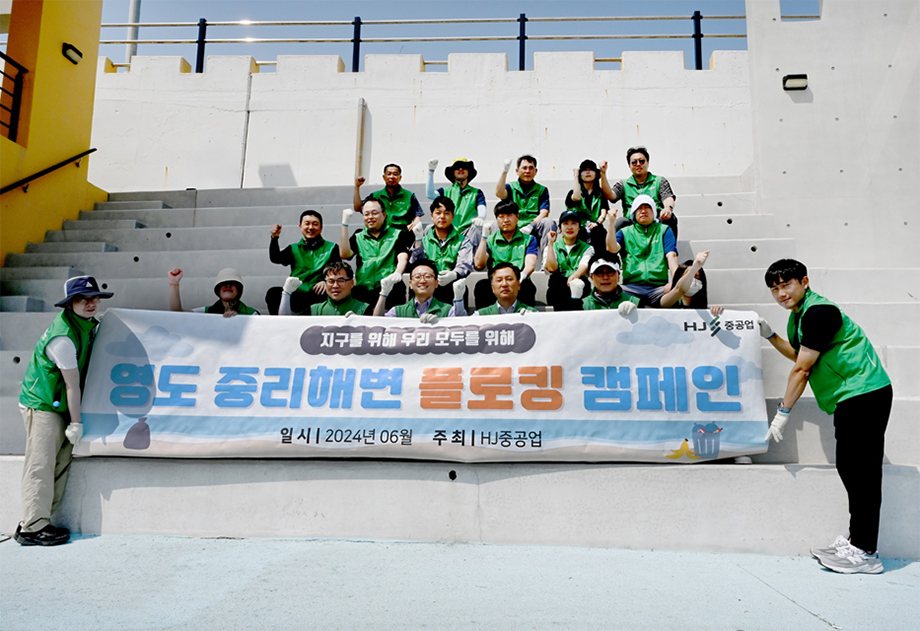
 Eco-Friendly Plogging Campaign at Jungni Beach, Yeongdo, Busan (June 2024)
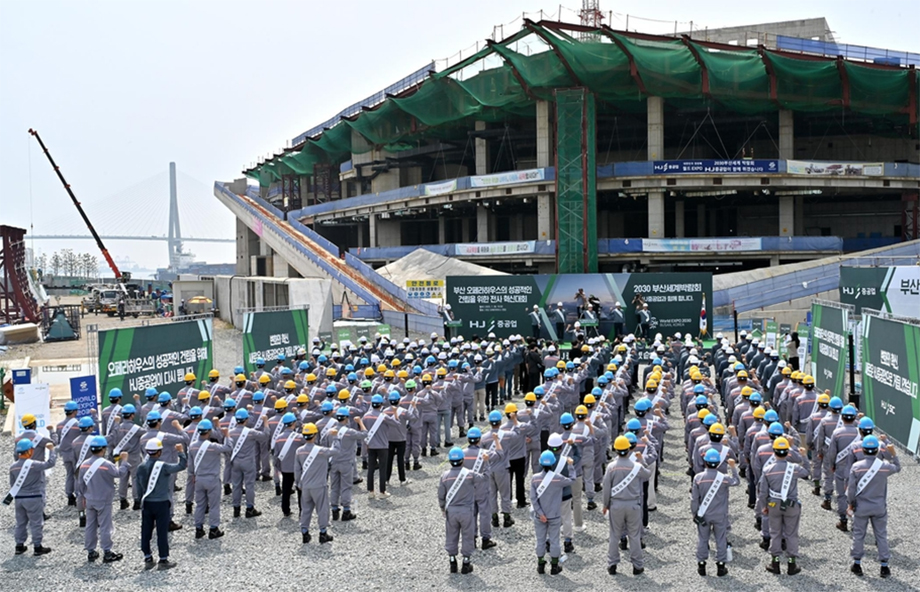
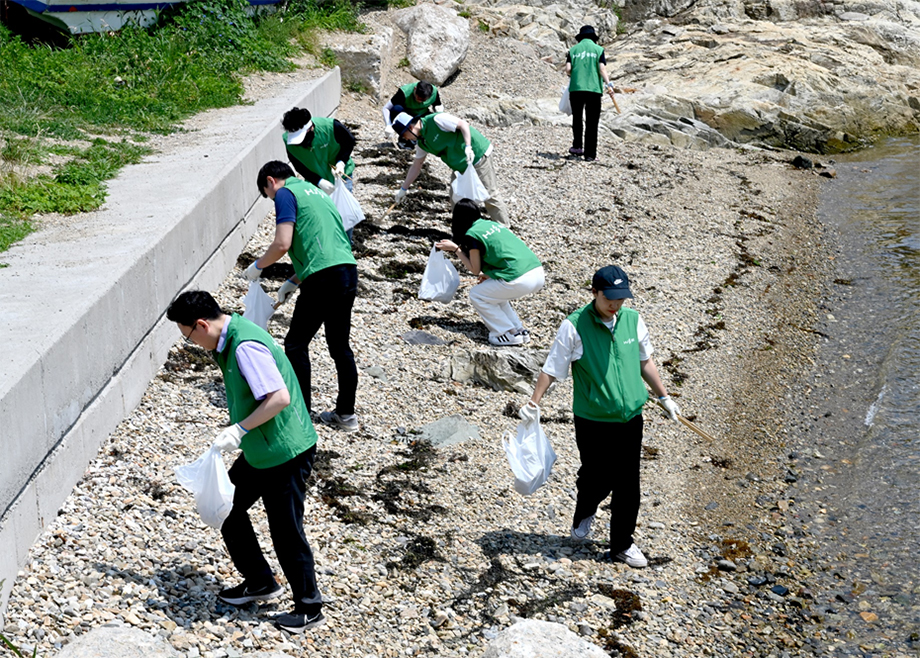 Plogging Campaign near the Busan Opera House Construction Site (July 2023)
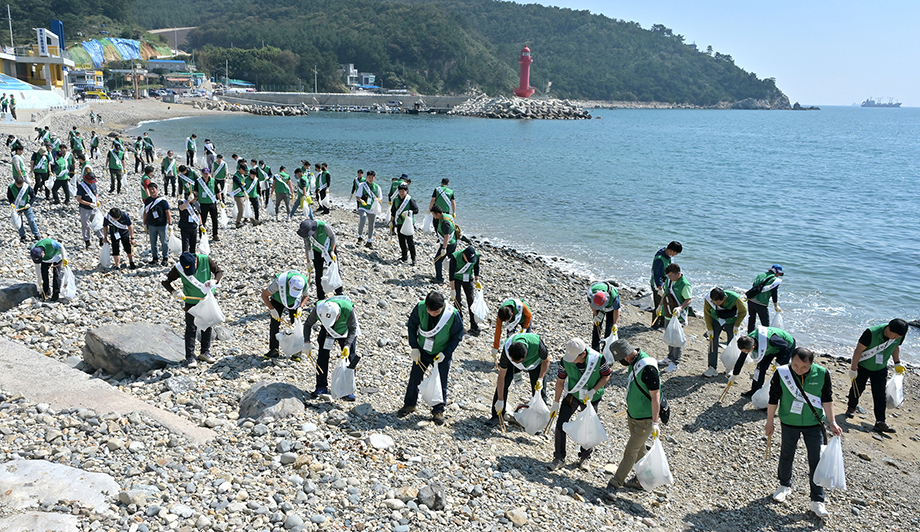
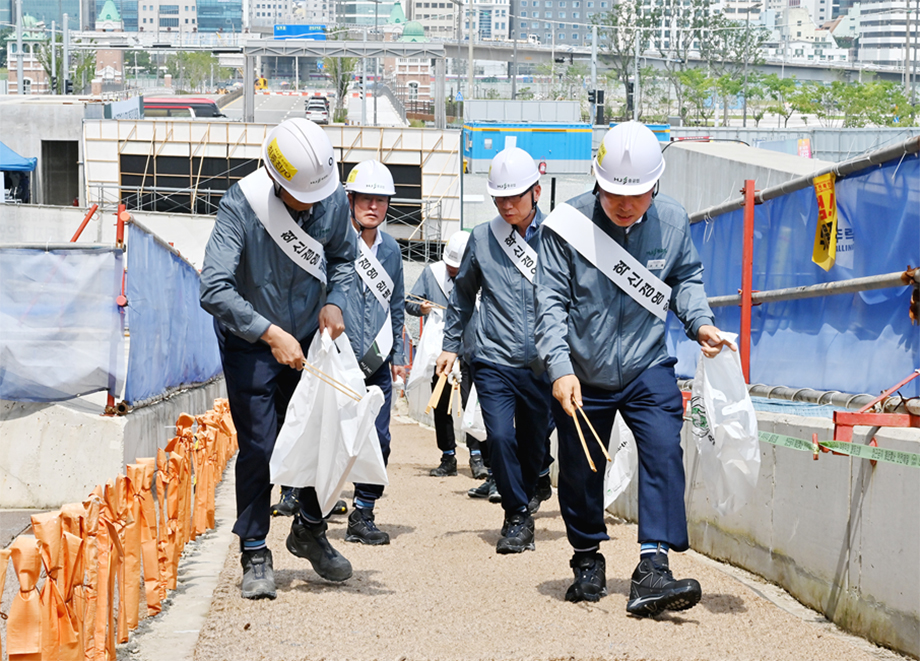 Eco-Friendly Plogging Campaign at Jungni Beach, Yeongdo, Busan (May 2023)

 Plogging Campaign at Bongnaesan Mountain and Jungni Beach, Yeongdo, Busan (September 2022)
 “Making Gumi Beautiful” Plogging Campaign around Dongnak Park, Gumi (July 2022)
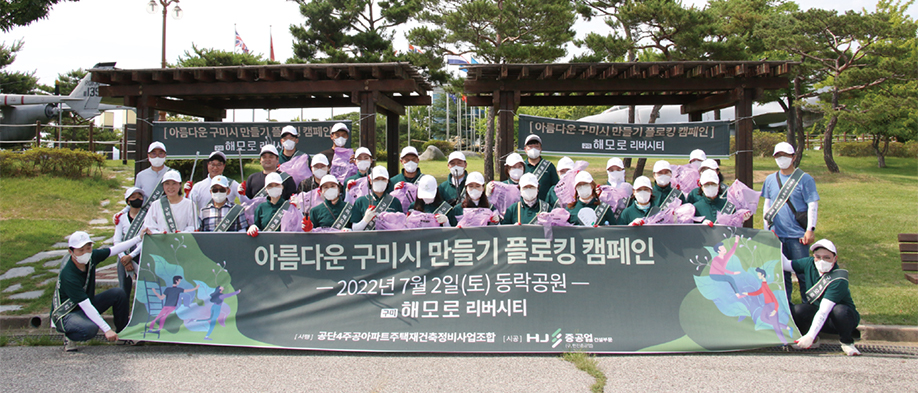
* Plogging is an environmental activity that combines the Swedish term “plocka upp,” meaning “to pick up,” with “walking.” Participants collect litter while walking, benefiting both their health and the environment. The activity has gained popularity worldwide.
Participation in ERT (Entrepreneurship Round Table)
* ERT (Entrepreneurship Round Table): An initiative led by the Korea Chamber of Commerce and Industry (KCCI), bringing together companies committed to putting a new spirit of entrepreneurship into practice.
Environmental Investment| Category | Unit | 2023 | 2024 | 2025 | Remarks |
|---|---|---|---|---|---|
| Investment in Environmental Facilities | KRW 100 million | 27.7 | 44.2 | 44.7 | Establishment and management of various environmental facilities at business sites, etc. |
| Investment in Environmental Technologies | KRW 100 million | 4.2 | 3.3 | 5.8 | Development of eco-friendly ship technologies, etc. |
| Total | KRW 100 million | 31.9 | 47.5 | 50.5 |
Eco-Friendly Revenue Criteria| Category | Sector (Item) | Indicator | Economic Activity (Sub-item) | Description |
|---|---|---|---|---|
| Construction Division | Green Sector [Cities & Buildings] |
1-RA-(2) |
|
|
| Shipbuilding Division | Transition Sector [Transportation] |
2-DA-(1) |
|
|
Eco-Friendly Revenue Performance| Category | Unit | 2023 | 2024 | 2025 | Remarks |
|---|---|---|---|---|---|
| Eco-Friendly Revenue | KRW 100 million | 4,040 | 4,925 | 5,259 | A |
| Construction of eco-friendly vessels | KRW 100 million | 4,040 | 4,925 | 5,259 | Indicator: 2-DA-(1) |
| Total Revenue | KRW 100 million | 21,621 | 18,860 | 19,997 | B |
| Eco-Friendly Revenue Ratio | % | 18.7% | 26.1% | 26.3% | A/B |
Eco-Friendly Procurement CriteriaEco-Friendly Procurement Performance| Category | Unit | 2023 | 2024 | 2025 | Remarks |
|---|---|---|---|---|---|
| Eco-Friendly Procurement | KRW million | 218 | 246 | 1,400 | A |
| GR (Good Recycled) | KRW million | - | - | 1,235 | |
| Other Recycled Raw Materials | KRW million | 218 | 246 | 165 | |
| Total Procurement | KRW million | 677,607 | 564,244 | 643,798 | B |
| Eco-Friendly Procurement Ratio | % | 0.032 | 0.044 | 0.218 | A/B |
Material Consumption| Construction Division | Unit | 2023 | 2024 | 2025 | Remarks |
|---|---|---|---|---|---|
| Ready-Mixed Concrete | m³ | 220,688 | 101,594 | 78,881 | |
| Aggregate | m³ | 33,396 | 58,755 | 66,141 | |
| Recycled Aggregate | m³ | 7,949 | 14,195 | 15,183 | Recycled Material |
| Recycled Sand | m³ | 3,286 | 307 | 444 | Recycled Material |
| Cement | Ton | 10,583 | 10,536 | 7,205 | |
| Asphalt Concrete | Ton | 628 | 1,785 | 824 | |
| Recycled Asphalt Concrete | Ton | - | - | 17,494 | Recycled Material |
| Reinforcing Steel | Ton | 28,087 | 16,310 | 15,765 | |
| Gypsum Board | m² | 499,878 | 243,258 | 43,432 |
| Shipbuilding Division | Unit | 2023 | 2024 | 2025 | Remarks |
|---|---|---|---|---|---|
| Steel Plate | Ton | 77,208 | 55,933 | 83,308 | |
| Structural Steel | Ton | 11,402 | 8,223 | 11,983 | |
| Cable | m | 1,254,314 | 1,353,582 | 910,049 | |
| Steel Grit (Shot Blasting Media) | Ton | 90 | 120 | 50 | Recycled Material |
Greenhouse Gas Emissions in 2025| Item | Emissions Intensity (tCO2-eq/KRW 100 million of Revenue) |
Total Emissions (tCO2-eq) | Direct Emissions (SCOPE 1) |
Indirect Emissions (SCOPE 2) |
||
|---|---|---|---|---|---|---|
| Target [A] | Actual [B] | Variance [B-A] | ||||
| GHG Emissions | 2.11 | 42,500 | 42,124 | -376 | 19,431 | 22,693 |
| Construction Division (All Domestic Construction Sites) | 5,000 | 4,853 | -147 | 1,067 | 3,786 | |
| Shipbuilding Division (Busan Yeongdo Shipyard & Geoje Plant) | 37,500 | 37,271 | -229 | 18,364 | 18,907 | |
* 2025 Revenue: KRW 1,999.7 billion
Greenhouse Gas Emissions over the Past Three Years (2023–2025)| Item | Unit | 2023 | 2024 | 2025 | Remarks |
|---|---|---|---|---|---|
| Total Emissions | tCO2-eq | 41,053 | 34,794 | 42,124 | |
| SCOPE 1 | tCO2-eq | 14,841 | 12,451 | 19,431 | |
| SCOPE 2 | tCO2-eq | 26,212 | 22,343 | 22,693 | Location-based |
| Emissions Intensity | tCO2-eq/KRW 100 million | 1.90 | 1.84 | 2.11 | Based on revenue |
* Based on all domestic business sites (Construction + Shipbuilding).
Energy Consumption in 2025| Item | Energy Intensity (TJ/KRW 100 million of Revenue) |
Total Consumption (TJ) | Remarks | ||
|---|---|---|---|---|---|
| Target [A] | Actual [B] | Variance [B-A] | |||
| Energy Consumption | 0.036 | 735 | 725 | -10 | |
| Construction Division | 100 | 94 | -6 | All Domestic Construction Sites | |
| Shipbuilding Division | 635 | 631 | -4 | Busan Yeongdo Shipyard & Geoje Plant | |
* 2025 Revenue: KRW 1,999.7 billion
Energy Consumption over the Past Three Years (2023–2025)| Item | Unit | 2023 | 2024 | 2025 | Remarks | |
|---|---|---|---|---|---|---|
| Total Energy Consumption | TJ | 728 | 611 | 725 | ||
| Direct Energy | Subtotal | TJ | 180 | 145 | 251 | |
| Diesel | TJ | 120 | 101 | 126 | ||
| B-A Fuel Oil | TJ | 0.5 | 0.9 | - | ||
| B-C Fuel Oil | TJ | 34 | 25 | 55 | ||
| LNG | TJ | 11 | 11 | 59 | ||
| Propane | TJ | 4.9 | 1.9 | 6.7 | ||
| Kerosene | TJ | 7.3 | 4.6 | 2.8 | ||
| Gasoline | TJ | 1.9 | 0.7 | 1.5 | ||
| LPG | TJ | - | 0.01 | 0.2 | ||
| Indirect Energy | Subtotal | TJ | 548 | 466 | 474 | |
| Electricity | TJ | 548 | 466 | 474 | ||
| Energy Intensity | TJ/KRW 100 million | 0.034 | 0.032 | 0.036 | Based on revenue | |
* Based on all domestic business sites (Construction + Shipbuilding).
GHG Emissions| Category | Unit | 2023 | 2024 | 2025 | Reporting Scope |
|---|---|---|---|---|---|
| Category 1: Purchased Goods and Materials | tCO2-eq | - | 236,132 | 300,118 | All Business Divisions (Construction + Shipbuilding) |
| Category 5: Waste Generated in Operations | tCO2-eq | 252 | 210 | 106 | Shipbuilding Division Business Sites |
| Category 6: Business Travel | tCO2-eq | 599 | 525 | 522 | All Business Divisions (Construction + Shipbuilding) |
| Category 7: Employee Commuting | tCO2-eq | - | 1,595 | 1,108 | All Business Divisions (Construction + Shipbuilding) |
Waste Generation in 2025| Item | Unit | Target [A] | Actual [B] | Variance [B-A] | Waste Generation Intensity (Ton/KRW 100 million of Revenue) |
|---|---|---|---|---|---|
| Total Waste Generated | Ton | 3,000 | 2,843 | -157 | 0.30 |
| Recycling Rate | % | 85.0% | 86.9% | 1.9% |
* Based on Shipbuilding Division business sites (Busan Yeongdo Shipyard and Geoje Plant).
Waste Generation and Treatment over the Past Three Years (2023–2025)| Item | Unit | 2023 | 2024 | 2025 | ||||
|---|---|---|---|---|---|---|---|---|
| Waste Generation Intensity | Total Waste Generated / Revenue | Ton/KRW 100 million | 0.41 | 0.38 | 0.30 | |||
| Recycling Rate | Amount Recycled / Total Waste Generated | % | 82.7% | 83.6% | 86.9% | |||
| By Waste Type | Total Waste | Total | Ton | 2,972 | 3,165 | 2,843 | ||
| Recycled | Ton | 2,459 | 2,647 | 2,470 | ||||
| Incinerated | Ton | 56 | 96 | 84 | ||||
| Landfilled | Ton | 457 | 422 | 289 | ||||
| Industrial Waste | General Industrial Waste | Subtotal | Ton | 2,793 | 2,946 | 2,565 | ||
| Recycled | Ton | 2,281 | 2,508 | 2,269 | ||||
| Incinerated | Ton | 54 | 16 | 7 | ||||
| Landfilled | Ton | 457 | 422 | 289 | ||||
| Designated Waste | Subtotal | Ton | 179 | 220 | 277 | |||
| Recycled | Ton | 177 | 139 | 200 | ||||
| Incinerated | Ton | 2 | 81 | 77 | ||||
| Landfilled | Ton | - | - | - | ||||
| Waste by Treatment Method | Outsourced Treatment | Subtotal | Ton | 2,972 | 3,165 | 2,843 | ||
| Recycled | Ton | 2,459 | 2,647 | 2,470 | ||||
| Incinerated | Ton | 56 | 96 | 84 | ||||
| Landfilled | Ton | 457 | 422 | 289 | ||||
| On-Site Treatment | Subtotal | Ton | - | - | - | |||
| Recycled | Ton | - | - | - | ||||
| Incinerated | Ton | - | - | - | ||||
| Landfilled | Ton | - | - | - | ||||
| Waste by Type | Total Waste Generated | Ton | 2,972 | 3,165 | 2,843 | |||
| Waste Sand | Ton | 457 | 422 | 337 | ||||
| Waste Oil-Based Paint | Ton | 122 | 193 | 63 | ||||
| Waste Oil | Ton | - | - | 8 | ||||
| Waste Paint Cans | Ton | 29 | - | 164 | ||||
| Waste Synthetic Resin | Ton | 1,428 | 1,703 | 1,636 | ||||
| Waste Wood | Ton | 487 | 444 | 564 | ||||
| Waste Mineral Oil | Ton | 29 | 27 | 42 | ||||
| Slag | Ton | 377 | 377 | - | ||||
| Dust | Ton | 44 | - | 28 | ||||
* Based on Shipbuilding Division business sites (Busan Yeongdo Shipyard and Geoje Plant).
Water Consumption in 2025| Item | Unit | Target [A] | Actual Consumption [B] | Variance [B-A] | Water Intensity (Ton/KRW 100 million of Revenue) |
|---|---|---|---|---|---|
| Total Water Consumption | Ton | 320,000 | 300,753 | -19,247 | 15.0 |
* Based on all domestic business sites (Construction + Shipbuilding).
Water Consumption over the Past Three Years (2023–2025)| Category | Item | Unit | 2023 | 2024 | 2025 | Remarks |
|---|---|---|---|---|---|---|
| Construction Division | Municipal Water | Ton | - | 85,232 | 63,707 | · All domestic construction sites |
| River Water | Ton | - | 60,886 | 75,932 | ||
| Recycled Water | Ton | - | 18,014 | 9,301 | ||
| Groundwater | Ton | - | 5,896 | 6,930 | ||
| Subtotal | Ton | - | 170,028 | 155,871 | ||
| Shipbuilding Division | Municipal Water | Ton | 170,429 | 158,470 | 144,882 |
· Busan Yeongdo Shipyard · Geoje Plant |
| River Water | Ton | - | - | - | ||
| Recycled Water | Ton | - | - | - | ||
| Groundwater | Ton | - | - | - | ||
| Subtotal | Ton | 170,429 | 158,470 | 144,882 | ||
| Total Water Consumption | Ton | 170,429 | 328,498 | 300,753 | ||
| Water Consumption Intensity | Ton/KRW 100 million | 23.5 | 17.4 | 15.0 | Based on revenue | |
| Water Reuse | Ton | - | - | - | ||
* 2023: Shipbuilding Division business sites only / 2024–2025: All domestic business sites (Construction + Shipbuilding).
Water Pollutant Management over the Past Two Years| Category | Unit | 2024 | 2025 | Remarks | |
|---|---|---|---|---|---|
| Total Water Pollutant Discharge | Ton | 0.27024 | 0.21603 | A+B+C | |
| By Pollutant | TOC | Ton | 0.02622 | 0.02133 | A |
| BOD | Ton | 0.05789 | 0.04966 | B | |
| SS | Ton | 0.18613 | 0.14503 | C | |
| Discharge Intensity | Ton/KRW 100 million | 0.0000143 | 0.0000108 | Based on revenue | |
* Scope: Domestic construction sites operating wastewater treatment facilities (6 sites).
* 2024 data has been revised due to a change in the data aggregation criteria (change in calculation scope).
Violations of Environmental Laws and Regulations| Category | Unit | 2023 | 2024 | 2025 |
|---|---|---|---|---|
| Violations of Environmental Laws and Regulations | Meetings | 2 | - | 1 |
| KRW million | 1.6 | - | 0.5 | |
| Item |
|
Not applicable |
|
* Based on all domestic business sites (Construction + Shipbuilding).
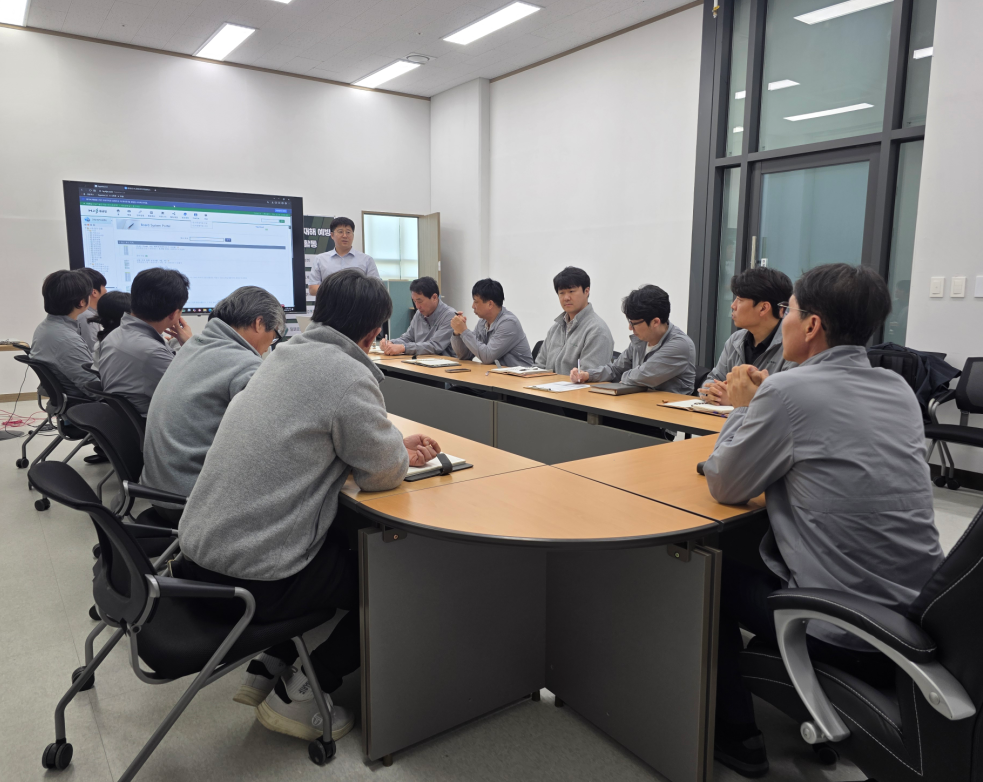
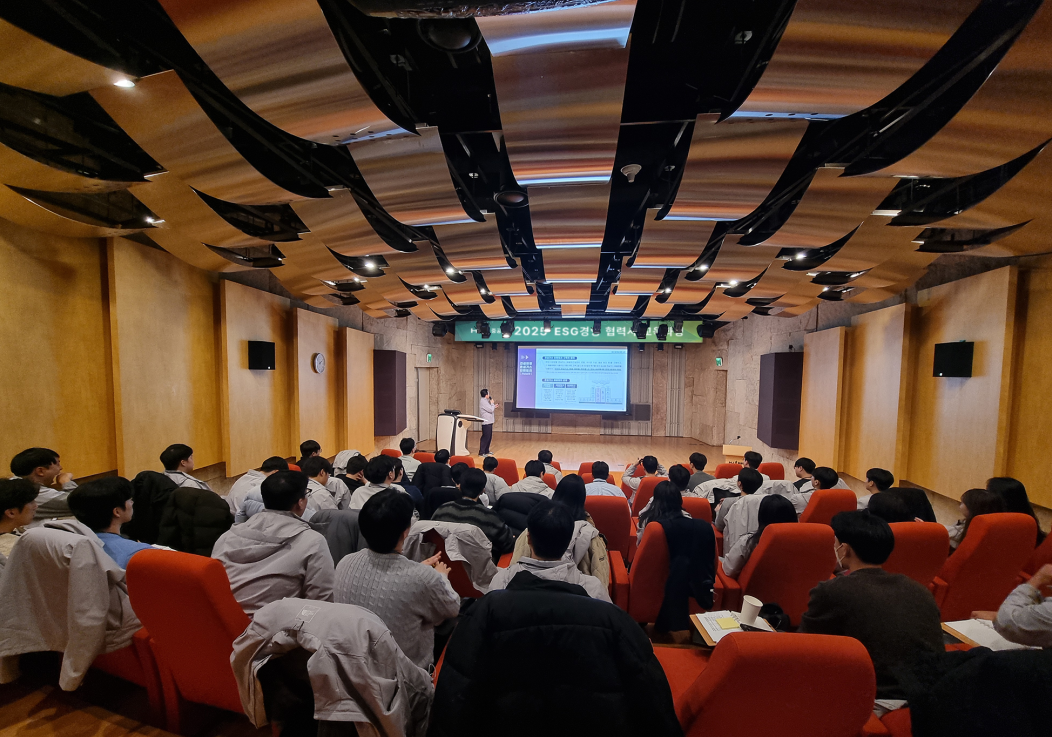
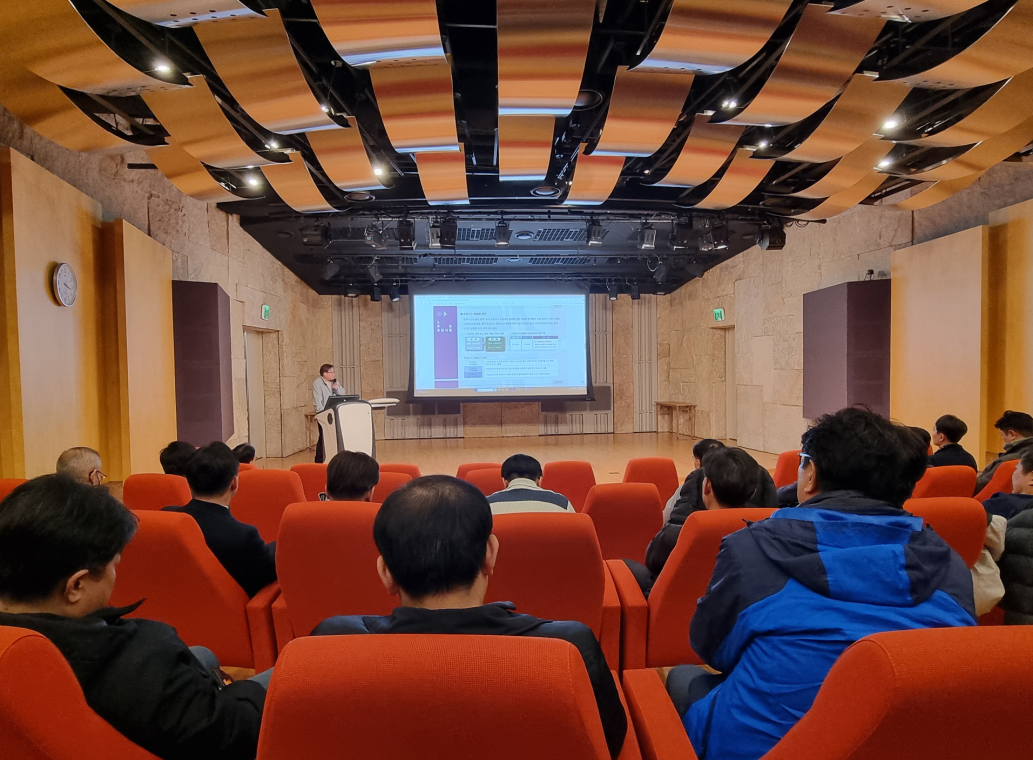
Environmental Training for Employees (2025)| Program | Target Participants | No. of Participants | Training Date | Training Purpose | Training Photos |
|---|---|---|---|---|---|
|
Quality & Environmental Training for All Construction Division Business Sites [Organized by the Construction Technology Research Team] |
All employees at business sites | 684 |
Training schedules established and implemented annually by each business site [74 sessions in total] |
|
|
| Training to Enhance Business Partners’ Awareness of ESG Management and Climate Change Response | Site managers/team leaders of major business partners | 62 | 2025.11.20 |
|
|
| Training on the Greenhouse Gas Emissions Management System for Construction Site Managers | Management team leaders at each business site | 26 | 2025.12.15 |
|
|
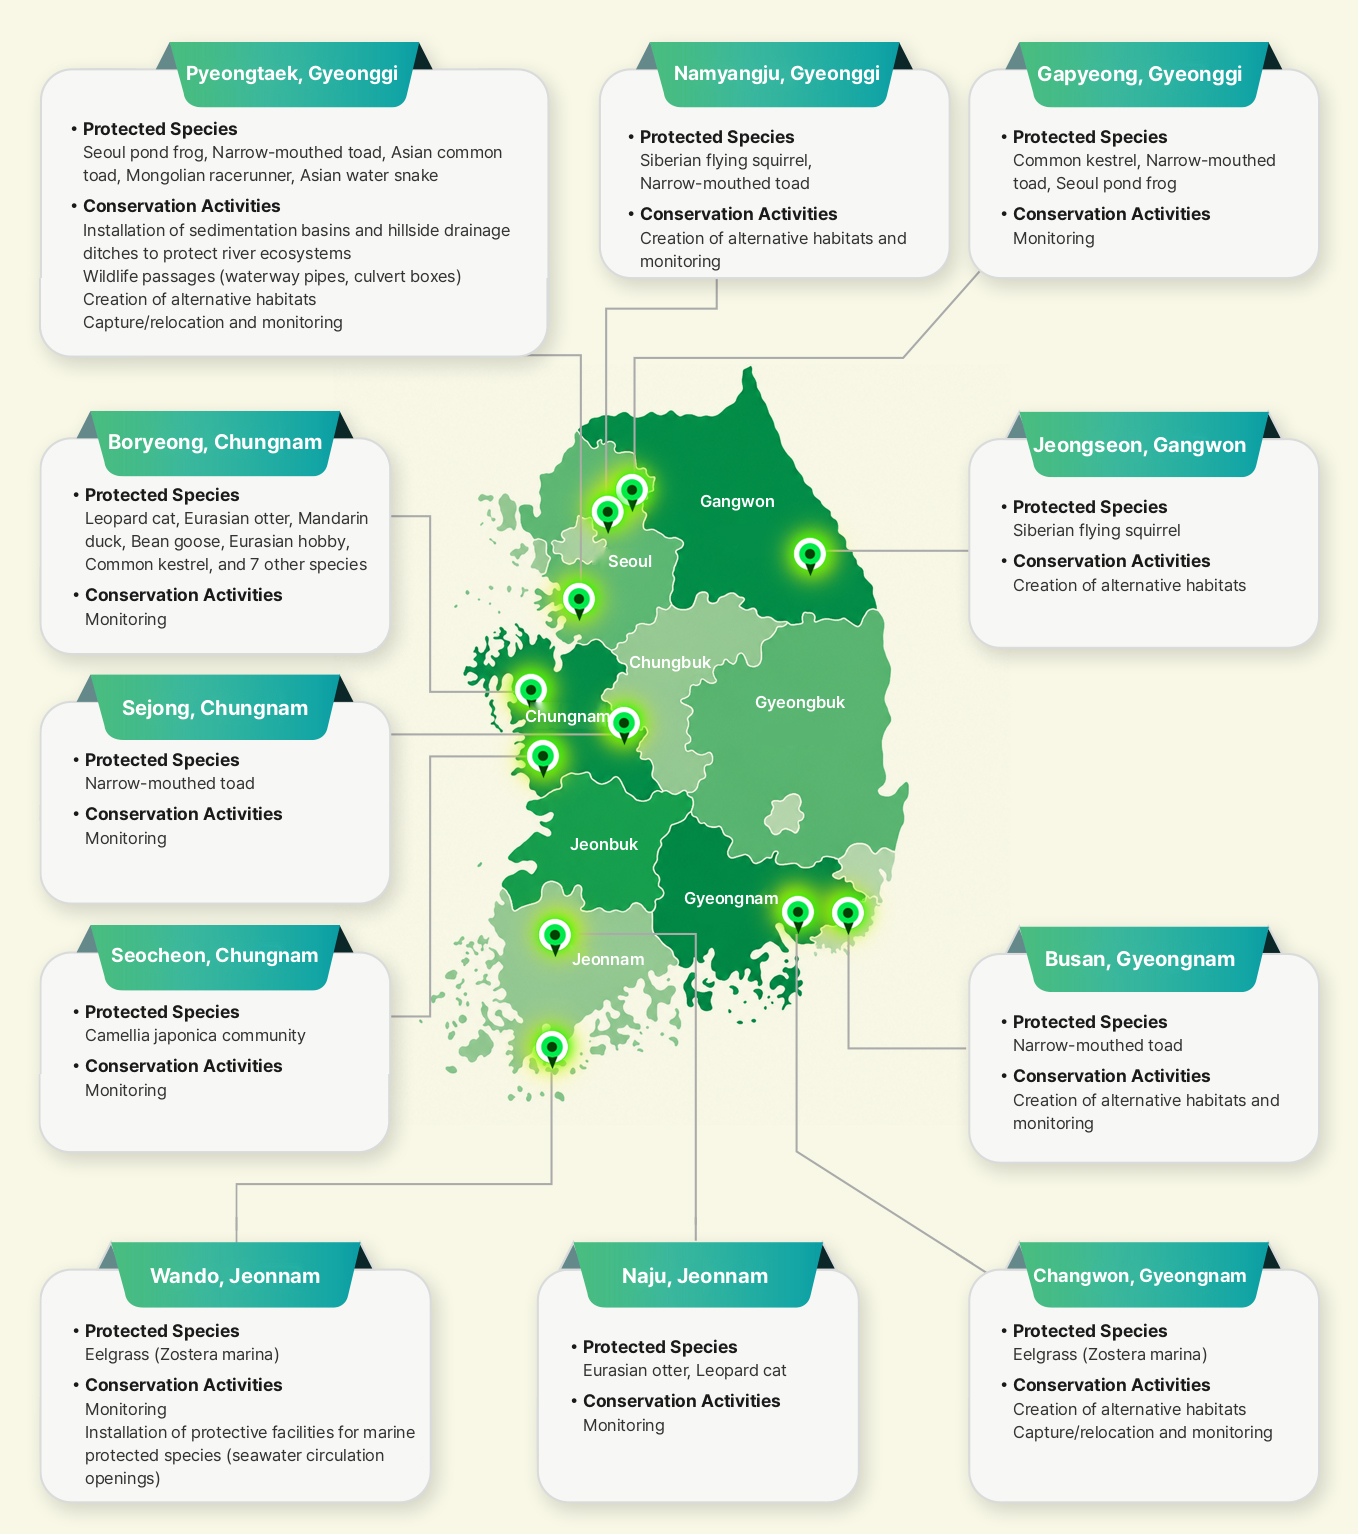
Biodiversity Conservation Activities at Construction Sites in 2025