Sustainability
We achieve sustainable growth
while fulfilling our economic and social responsibilities.
- Officers & Employees
-
Officers & Employees
Unit 2020 2021 2022 Total Officers & Employees Persons 1,949 2,037 2,050 Officers Total Persons 39 43 45 Total Persons 39 43 45 F Persons - - - Employees Total Persons 1,910 1,994 2,005 Per Employment Type Full-time Persons 1,718 1,752 1,793 Part-time Persons 192 242 212 Gender M Sub-total Persons 1,862 1,933 1,937 Full-time Persons 1,681 1,711 1,746 Part-time Persons 181 222 191 F Sub-total Persons 48 61 68 Full-time Persons 37 41 47 Part-time Persons 11 20 21 Per Age Below 30 Persons 39 124 121 30~51 Persons 1,247 1,208 1,217 Over 51 Persons 624 662 667 Managers
(higher than managers)Male Managers Persons 1,261 1,326 1,346 Female Managers Persons 16 22 31 Rati of Female Managers Persons 1.3% 1.6% 2.3% Per Region Korea Persons 1,898 1,979 1,991 Philippines Persons 12 15 14 Diversity of Employees Water Veterans Persons 61 57 55 Foreigners Persons - - 1 The Disabled Persons 34 30 31 ※ Employees in other employment types except full-time and part-time employees not included.
- Workers except Officers & Employees
-
Workers except Officers & Employees
Unit 2020 2021 2022 Total Persons 332 345 303 M Persons 197 201 167 F Persons 135 144 136 ※ Target Audience: Dispatched and Regular Employees
- New Recruitment
-
New Recruitment
Unit 2020 2021 2022 Per Gender Persons 183 279 330 Gender M Full-time Persons 39 112 177 Contract Persons 133 144 133 F Full-time Persons 1 5 5 Contract Persons 10 18 15 Per Age Below 30 Full-time Persons 16 69 28 Contract Persons 16 46 29 30~51 Full-time Persons 23 48 147 Contract Persons 106 84 78 Over 51 Full-time Persons 1 - 7 Contract Persons 21 32 41 Ratio of Newly Employed % 9.6% 14.0% 16.5% ※ Ratio of Newly Employed: Total No. of Newly Employed/Total No. of Employees
- Training for Officers & Employees
-
Training for Officers & Employees
Unit 2020 2021 2022 Total Hours of Training Hours 36,702 38,795 38,046 Training Programs Completed Programs 51 60 72 Average Training Hours per Person Hours 18.8 19.0 18.6 Training Expenses for Officers & Employees Million KRW 81.7 122.5 322.1 ※ Performance index management/operation : The education and training evaluation index is implemented to objectively evaluate and improve effects and values of education and training programs.
- Job competency development education status
-
Job competency development education status (2022)
No Programs Targets No. of Attendants (Persons) Total Hours of Education (Hr) 1 Advanced Program for New Recruits New recruits in 2021 55 660 2 Beginning Program for New Recruits New recruits in 2022 15 1,080 3 Advanced Program for Career Employees Career employees in 2021 and 2022 80 1,360 4 Advanced Program for New Recruits New recruits in 2022 14 294 5 Online Program for E-Procurement System Official duties on site & relevant employees in the head office 71 249 6 Practical Program for Official Duties on Site Official duties on site 44 748 7 Program for Manufacturing Workers Manufacturing workers 29 58 8 Leadership Program Section/team leaders 71 142 9 Job Training Program Career employees in 2022 30 240 10 Multifunctional Competency Program for Manufacturing Workers Other workers except welders 6 240 ※ Except License Renewal Education (commissioned education)
- Parental Leaves
-
Parental Leaves
Unit 2020 2021 2022 Subjects of Parental Leaves Persons 484 423 424 Subjects of Parental Leaves(F) Persons 14 15 15 Subjects of Parental Leaves(M) Persons 470 408 409 Employees on Parental Leaves Persons 20 12 20 Employees on Parental Leaves(F) Persons 5 4 5 Employees on Parental Leaves(M) Persons 15 8 15 Employees from Parental Leaves Persons 18 16 19 Employees from Parental Leaves(F) Persons 4 5 5 Employees from Parental Leaves(M) Persons 14 11 14 Long-term Employed for over 1 Year after Parental Leaves Persons 10 17 10 Long-term Employed for over 1 Year after Parental Leaves(F) Persons 2 5 4 Long-term Employed for over 1 Year after Parental Leaves(M) Persons 8 12 6 Employees to Return from Parentl Leaves Persons 19 17 20 Employees to Return from Parentl Leaves(F) Persons 4 5 5 Employees to Return from Parentl Leaves(M) Persons 15 12 15 Ratio of Employees Returned from Parental Leaves % 94.7% 94.1% 95.0% Ratio of Long-term Employed Returned from Parental Leaves % - 94.4% 62.5% ※ Ratio of employees returned from parental leaves = (No. of employees returned from parental leaves/No. of employees to return from parental leaves) x 100
※ Ratio of long-term employed returned from parental leaves = (No. of long-term employed for over 12 months after parental leaves/Total No. of employees returned from parental leaves during the reporting period) x 100
- Ratio of Labor Union Members
-
Ratio of Labor Union Members
Unit 2020 2021 2022 No. of Employees Qualified for Labor Union Subscription Persons 1,672 1,703 1,746 No. of Employees with Labor Union Membership Persons 881 1,011 1,005 Ratio of Labor Union Members % 52.7% 59.4% 57.6% ※ Those who are not qualified for labor union subscription: directors, appointed employees(team leaders, business part leaders), and employer-based departments
- Labor-Management Council
-
- HJ Shipbuilding and Construction operates the labor-management council to contribute on corporate development by pursuing the joint benefits of labor and management body through the faithful discussion on the basis of the mutual confidence between employees and management.
- Labor-Management Council is divided into construction and shipbuilding labor-management councils. The ordinary meetings are held four times a year(Mar., Jun., Sep., Dec.). When any party submits items, the extraordinary labor-management meeting is held.
- Environment Management Participation Program for Directors and Employees
-
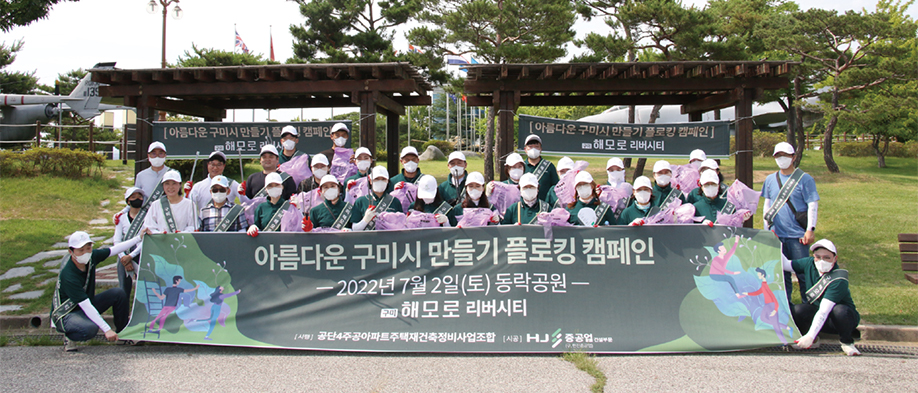
Flogging campaign 'Make Beautiful Gumi' around Dongrak park in Gumi(Jul. 7, 2022) : directors and employees of HJSC and partners and about 60 other participants
Flogging campaign in Bongraesan Mountain in Busan and Jungri Beach in Yeongdo (Sep. 29, 2022) : about 200 directors and employees of HJSC
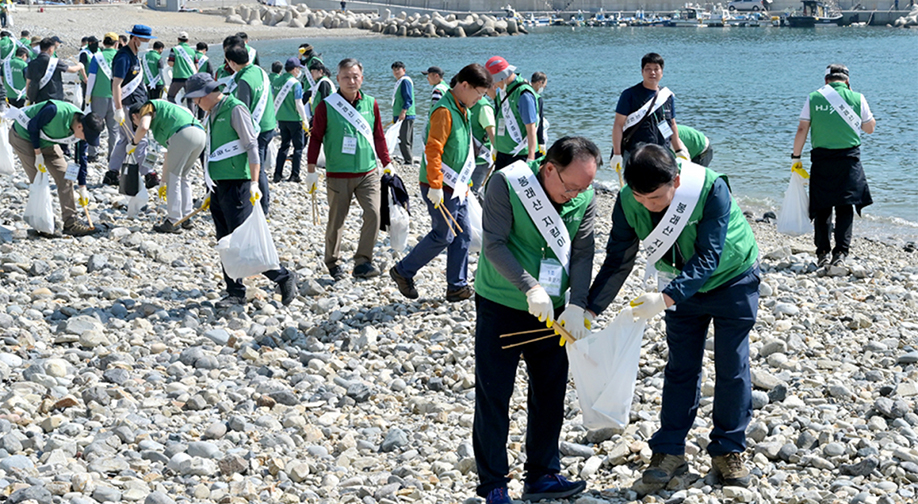
※ Plogging: Plogging is the compound word of Plocka upp meaning picking up gathering grains in Swedish and walking in English. Plogging is substantially favored all over the world as the activity to protect environment as taking care of nature and health by collecting litters as walking or strolling.
ERT(Entrepreneurship Round Table) Activity
- Date of Joining: Sep. 22, 2022
-
Exhibition event using card news for encouraging directors and employees to participate in the joint challenge implemented by ERT.
Joint Challenge 1: Practice of environment protection activities (picking up litters into the volume-based waste bags outside, taking garbage home, etc.)
Joint Challenge 2: ZERO WASTE DAY (using reusable cup/recyclables, paperless, etc.)
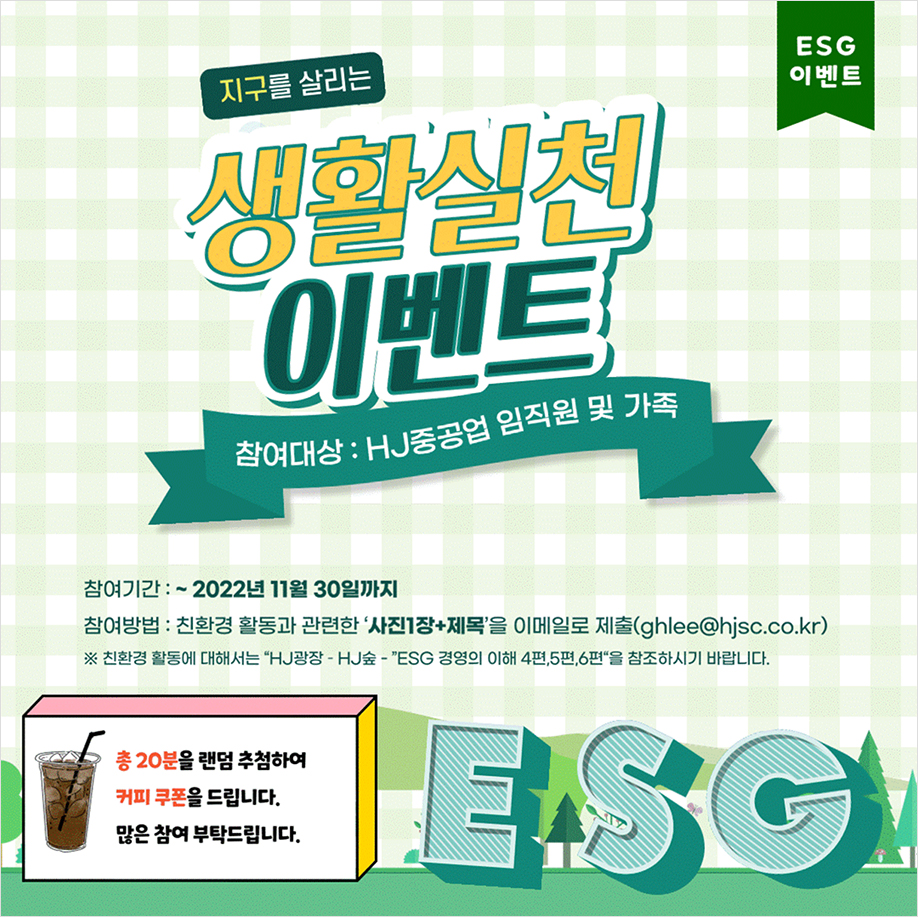
※ ERT : Meeting of enterprises aiming to implement new entrepreneurship as the Entrepreneurship Round Table led by Korea Chamber of Commerce and Industry.
- Environment Laws Management Process
-
Environment Laws Management Process
Section PROCESS Input Action Process Output Environment Management Supervision Division Teams/Sites Planning 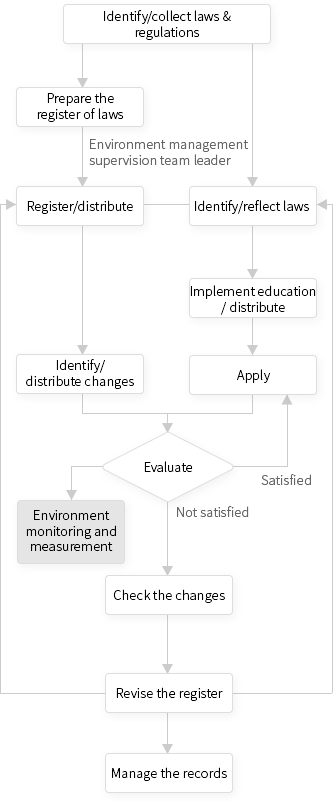
Contract
Restrictions
Laws
Municipal ordinances
Regulations
Rules- Supervision team leader & team leader/site manager designates a team member responsible for laws who has to identify and collect laws, regulations and ordinances of competent city/province/district related to a project.
- A supervision team leader prepares the register of environment-related laws related to a project.
- A team leader/site manager checks the enterprise register of laws, identifies the additional regulations related to a project and prepares the team/site register of laws.
Register of environment-related laws Implementation Legal requirements
Contractual requirements- A person in charge of laws implements education on the prepared register of laws for a relevant organization and distributes the register if required.
- The register of laws shall be kept in the sites performing a project and applied to relevant work.
Education register. Check & Evaluation Materials related to the latest laws - A management supervision team leader & a team leader/site manager shall check the register of laws and ordinances of relevant cities/provinces/districts on a regular basis to confirm whether the latest version is kept.
- If the latest version is not kept, changes shall be immediately identified.
Problems identified by checking.
ChangesActions & Improvement Revision - A person in charge of laws shall revise the register of laws and perform the same process as those for the first registration.
- A person in charge of laws shall keep the latest version of relevant laws kept and the register of laws and manage and keep the documents related to this process as the records.
Register of revised laws.
- Environment Investment
-
Environment Investment
Unit 2020 2021 2022 Remarks Environment-related Facility Investment Hundred Million KRW 22.9 44.5 37.8 Air pollution reduction device in painting workshop, etc. Environment-related Technology Investment Hundred Million KRW 0.1 2.1 5.9 Eco-friendly hybrid-powered vessel of next generation, etc. Total Hundred Million KRW 23.0 46.6 43.8
- Eco-friendly Materials Procurement (Recyclable Materials)
-
Eco-friendly Materials Procurement (Recyclable Materials)
Recycled Aggregates Unit 2020 2021 2022 Remarks Amount of Purchase ㎥ 1,609 7,612 3,349 Recycled materials Price Million KRW 10.4 38.4 26.3 Steel Grit (Short Ball) Unit 2020 2021 2022 Remarks Amount of Purchase ton 68 60 30 Recycled materials Price Million KRW 50.8 68.4 35.4
- Amount of Materials Used
-
Amount of Materials Used
Construction Unit 2020 2021 2022 Remarks Ready-mixed concrete ㎥ 148,442 400,087 298,222 Aggregates ㎥ 9,220 27,796 25,008 Recycled aggregates ㎥ 1,609 7,612 3,349 Recycled materials Recycled sand ㎥ - - 3,485 Recycled materials Cement ton 34,555 16,124 42,069 Asphalt concrete ton 12,352 7,494 9,734 Rebar ton 35,786 59,717 41,900 Gypsum board ㎥ 80,174 133,564 657,962 Shipbuilding Unit 2020 2021 2022 Remarks Steel sheet ton 2,976 1,494 41,241 Section steel ton 557 207 5,533 Cable m 176,396 276,285 418,838 Steel Grit (Short ball) ton 68 60 30
- Greenhouse gas emission & energy usage
-
Greenhouse gas emission & energy usage
Unit 2020 2021 2022 Remarks Total Emission tCO2-eq 10,754 18,700 19,539 Direct Emission tCO2-eq 1,798 6,113 11,451 SCOPE 1 Indirect Emission tCO2-eq 8,956 12,582 8,088 SCOPE 2 Emission in KRW tCO2-eq/Hundred Million KRW 2.4 3.7 6.1 Based on Sales Unit 2020 2021 2022 Remarks Annual Energy Usage TJ 208 340 320 Energy Usage in KRW TJ/Hundred Million KRW 0.05 0.07 0.10 Based on Sales ※ Based on Shipbuilding Business Sites (Construction: Greenhouse gas inventory to be implemented)
- Waste
-
Waste : Waste is continuously managed by Waste Management System(Allbaro).
Unit 2020 2021 2022 Remarks General Waste ton 2,174 1,992 1,541 As of Allbaro Report Designated Waste ton 164 219 93 Total Waste ton 2,339 2,211 1,634 Total waste treatment by a contractor ※ Based on Shipbuilding Business Sites (Construction: Internal Environment Data Management System to be implemented)
- Water Usage
-
Water Usage
Unit 2020 2021 2022 Remarks Water Supply & Sewage ton 139,304 144,323 127,388 Water Usage in KRW ton/Hundred Million KRW 30.7 28.3 39.8 Based on Sales ※ Based on Shipbuilding Business Sites (Construction: Internal Environment Data Management System to be implemented)
- Infringement of Environment Laws
-
Infringement of Environment Laws
Unit 2020 2021 2022 Remarks Infringement of environment laws Times 3 - 3 Generation of scattered dust, ecessive noise, etc. Million KRW 3.0 - 2.6
- Quality & Environment Education & Check
-
Quality & Environment Education & Check
Unit 2020 2021 2022 Remarks Head Office Times 24 21 22 Sites Times 90 104 99
- Internal Management Criteria related to Environment
- Soil Remediation Activity
- Stranded Assets : Not relevant
- Not relevant